
This blog was co-authored by Dave Brear, Sr. Principal Architect
Citrix Observability provides customers with the right tools under the same umbrella to enable administrators in their modern management journey. Monitoring and troubleshooting in daily operations requires advanced features to take proactive actions and deep-dive analysis of the Citrix environment and user sessions.
To take your Citrix administration to the next level, Citrix Observability consists of three components: Citrix Monitor, Citrix Analytics and uberAgent.
We invite you to sign up or watch on demand our Citrix Observability Master Class on August 15th where you’ll learn how to maximize your Citrix management experience.
In this blog we are going to focus on Citrix Monitor as part of the Observability platform, where you’ll learn about the key features that allow you to analyze your Citrix environment, enable proactive monitoring and support faster reactive troubleshooting. These capabilities ensure an improved user experience while also optimizing running costs.
Key advanced features
Citrix Monitor is part of all licensing stacks and provides advanced features and is constantly integrating technologies from the observability tools. In the console you’ll find insights that will help you to enhance your Citrix Infrastructure management.
Let’s take a look at some key features and how you can use them on a day to day basis:
- Session performance and logon analysis: When users complain about slow applications or taking so long to access resources, Citrix administrators require the tools and data to diagnose and find the root cause of the issue. It can be in the infrastructure layer or from the end user endpoint.
As part of your troubleshooting you need to validate the network performance. There’s nothing better than a deep analysis of what’s happening between the user session and the network. Citrix Monitor now provides you with the insights to make your troubleshooting more efficient.
Start with the following insights:
- End to end network analysis:
-
- ICA Latency: This is basically the network latency. It indicates if the network is sluggish.
- ICA RTT: This is the time interval between a user’s action and the graphical response displayed on their screen. This measurement includes ICA Latency, Endpoint Delay, and Host Delay.
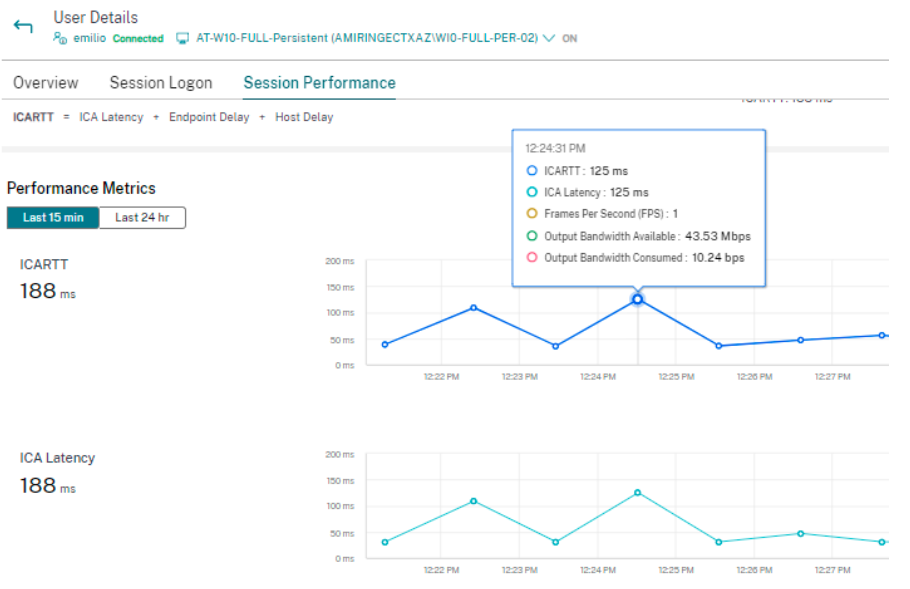
- Session performance metrics:
-
- Output Bandwidth Consumed – indicates the actual amount of data transmitted from the VDA to the endpoint to display sessions to users.
- Output Bandwidth Available – Monitor the total bandwidth available to transmit data from the VDA to the endpoint.
- Frames Per Second – use this parameter to validate the session responsiveness.

- Cost Optimization and Right Sizing: This feature allows you as an administrator to analyze the usage of virtual machines and sessions effectively. It provides you with insightful visual representations on how to optimize VDA Infrastructure cost. It also helps you to eliminate unnecessary machines and thereby reduce costs.
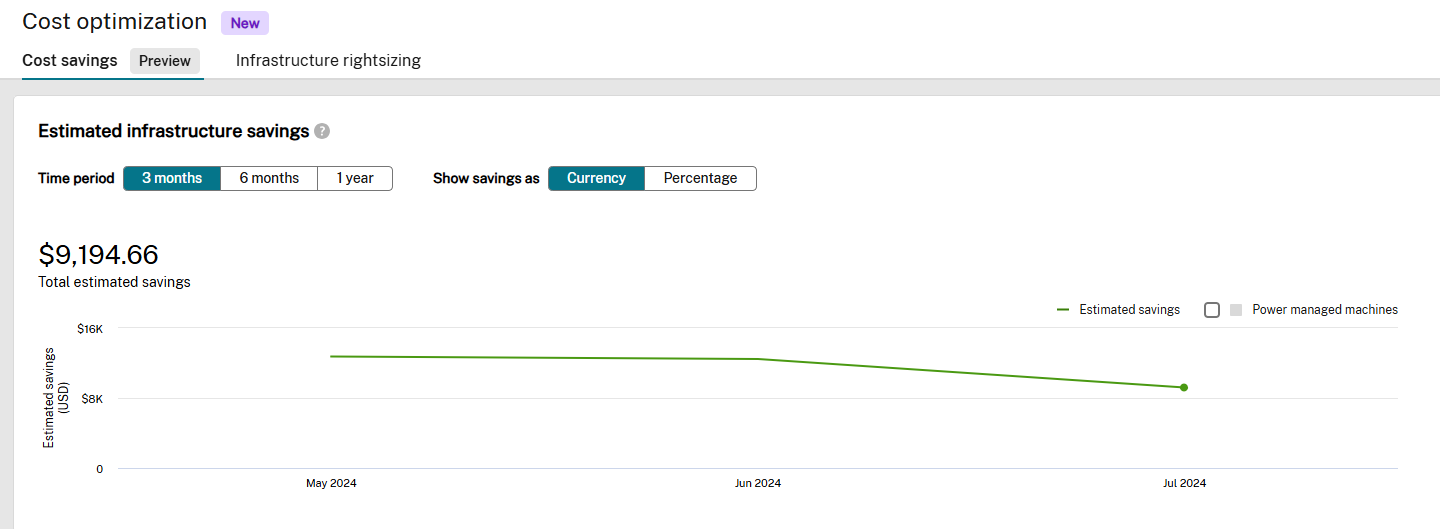
The Cost Optimization page includes the following features: Cost Savings and Right Sizing. Let’s explain both.
- Cost Optimization page (In Preview): It provides you detailed information on different scenarios that might cause you to exceed the expected cost. Similarly, for example, if there are machines with no sessions, it shows you further opportunities for cost savings.
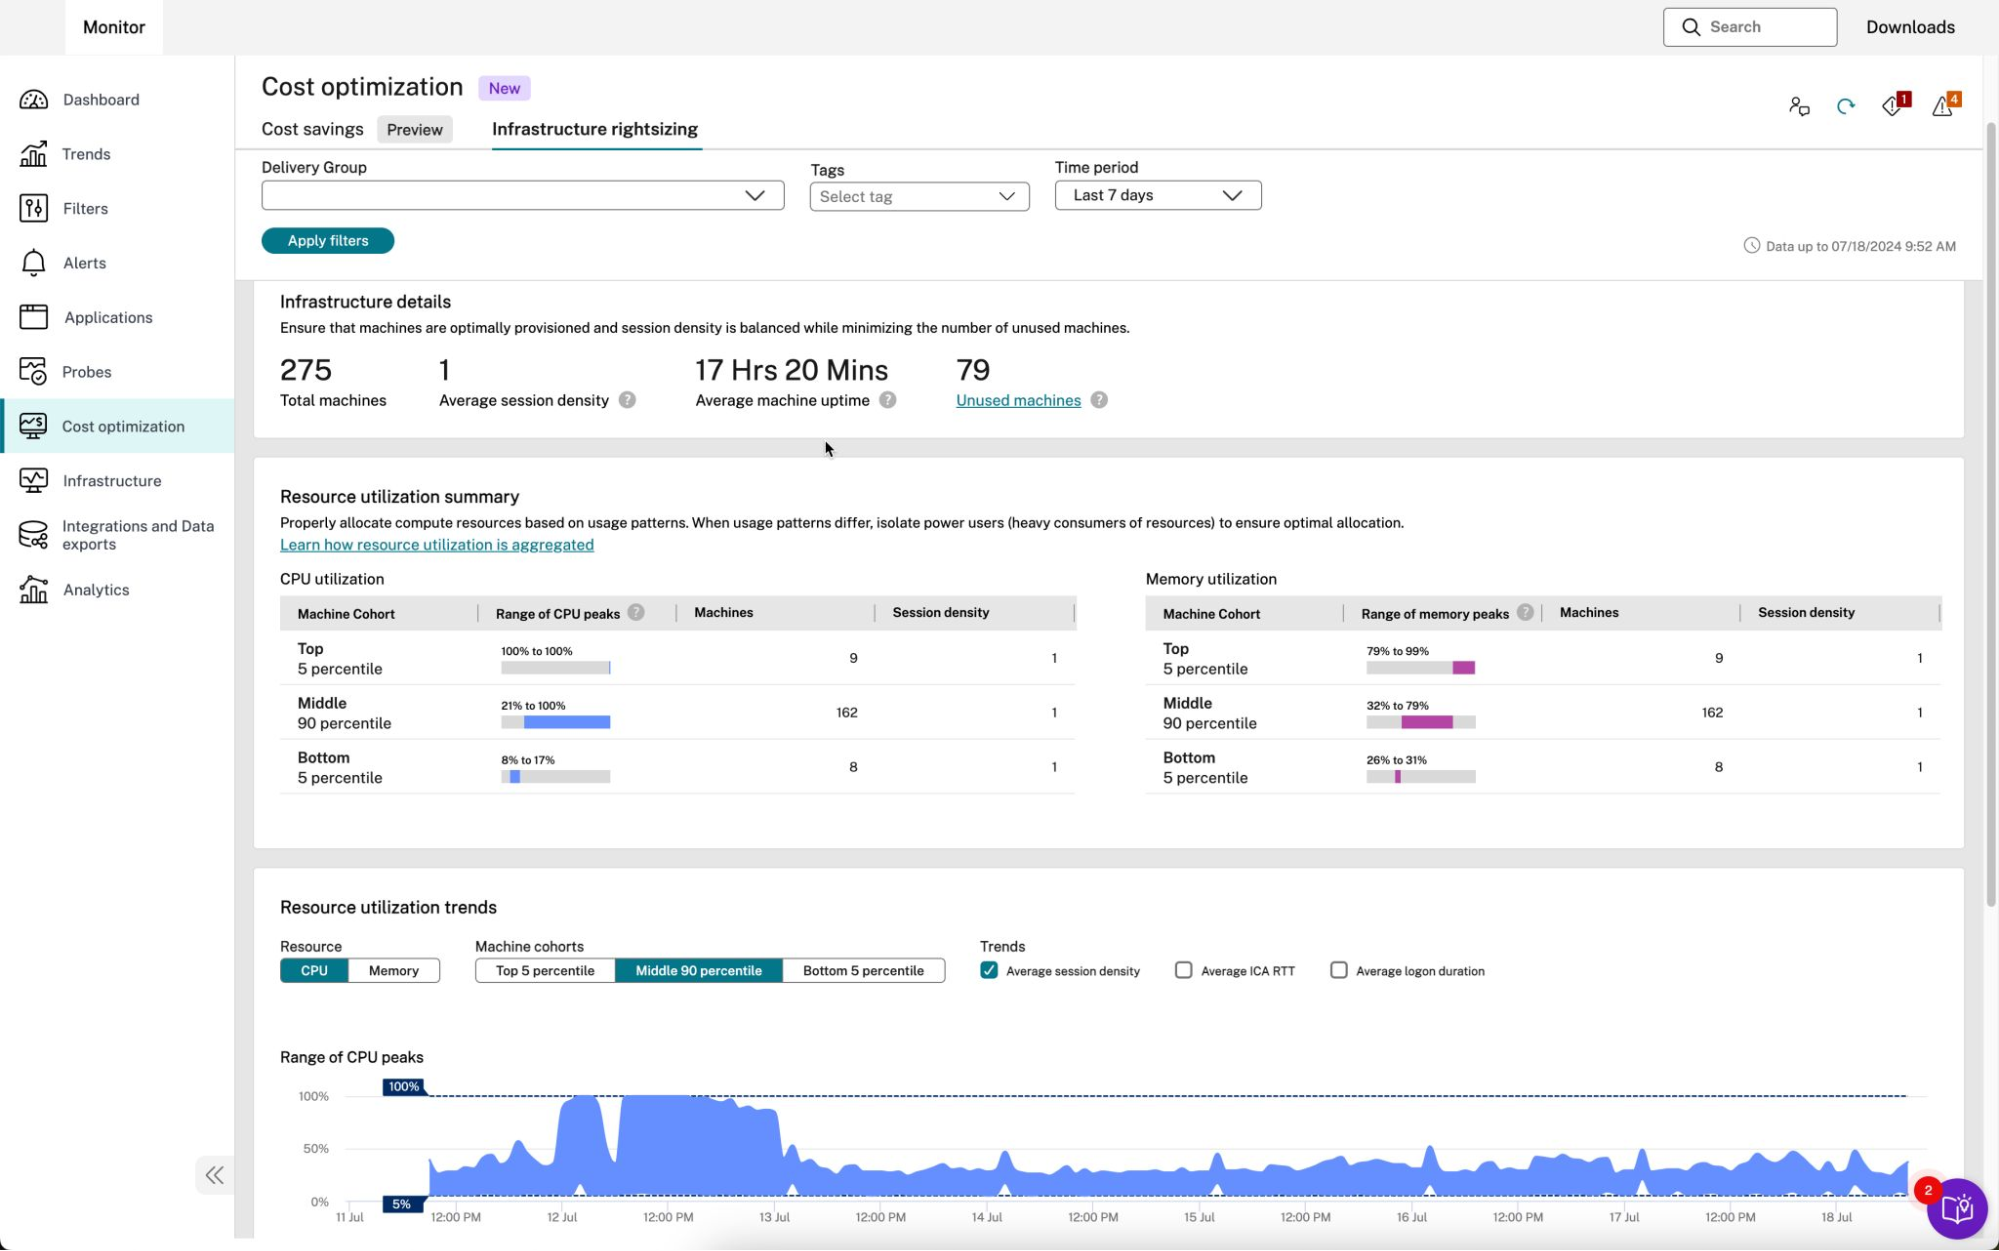
- Rightsizing and resource utilization. Analyze the provisioning and sizing aspects of your workloads, giving you the information needed to tune the specification and quantity to most efficiently meet your workload demands. Information includes:
- Utilization details, including total hosts in use (and not in use) and average session density per host
- Resource utilization summary: It provides a summary of CPU and memory usage
- Resource utilization trends: This is a graphical representation which you can use to identify resource consumption peaks and plan for future usage
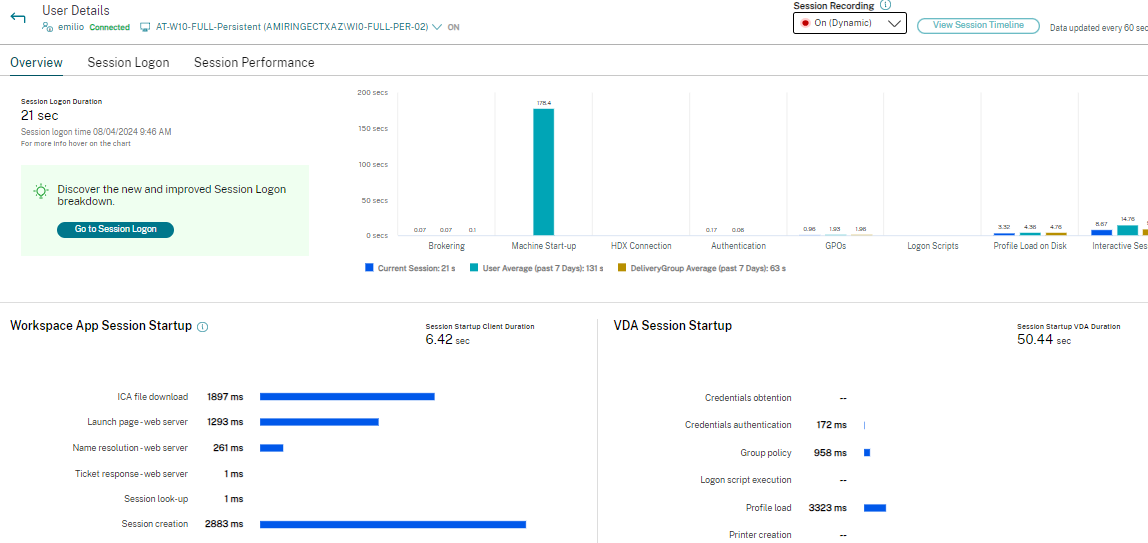
- User analysis and Activity manager: Whether you want to monitor an active session or troubleshoot an event in the past, Citrix Monitor gives you new insights about user session performance and launch failures. From a single pane of glass, the activity manager allows you to execute tasks such as restart the session, reset the profile, and reset the personal virtual disk.
Also, you’ll get details such as session status, you’ll be able to execute a health check to the user session and insights about the process of launching Applications and Desktops.
- Capacity Management and resource utilization: Knowing how single or multi-session operating systems are consuming resources, what happens during peak times and what applications require more resources will give you the visibility to take actions and decisions on your capacity planning. In other words, having a good view of current capacity trends ensures you can effectively optimize your current environment and plan for the future.
Now, how can you use Citrix Monitor data in your capacity planning:
- Ensure you have enough resources to provide access to Virtual applications and desktops to your end users. Fine tune your Power Management solution either if you are using Autoscale or any other process.
- Manage the amount of resources allocated to a virtual machine and the number of virtual machines that you have powered on on your infrastructure. By having a good capacity management, your users will have the required tools to support your production operations as well as keeping costs down.
The following table provides information on the possible action items that you can do based on the values present in the Resource Utilization dashboard:
| Scenario | Action item |
| CPU utilization is more | Increase the CPU specifications of the delivery group. Or, identify the higher usage users and move them to a different delivery group with better specifications. |
| CPU utilization is less | Decrease the CPU specification of the delivery group. |
| Memory utilization is more | Increase the memory specification of the delivery group. |
| Memory utilization is less | Decrease the memory specification of the delivery group. |
Getting started with Citrix Monitor advanced features
Citrix Monitor is included in your licensing and is very simple to use. It provides insights and powerful data for your daily administration, allowing you to perform proactive monitoring, troubleshooting and cost management.
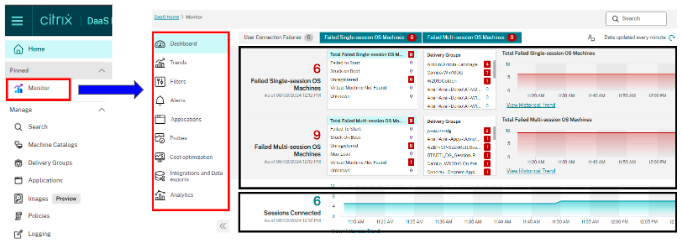
Just launch the Citrix Monitor console, in the left Panel you get access to the new features that have been released in the latest version. Identify either the session you want to monitor, a specific delivery group or start analyzing infrastructure to have better cost management.
What’s next
We have great resource available for you
- Citrix Monitor documentation
- Citrix Monitor – explained feature video
- Citrix Monitor – what’s new
- Observability Master Class
Disclaimer: This publication may include references to the planned testing, release and/or availability of Cloud Software Group, Inc. products and services. The information provided in this publication is for informational purposes only, its contents are subject to change without notice, and it should not be relied on in making a purchasing decision. The information is not a commitment, promise or legal obligation to deliver any material, code, or functionality. The development, release, and timing of any features or functionality described for products remains at the sole discretion of Cloud Software Group, Inc.