We’ve come to the end of the “What’s New in Director 7.6” series. Back in July, I posted a blog on the upcoming “Hosted Application Usage feature” that was delivered with XenApp/XenDesktop 7.6. I highlighted the importance of being able to report on peak concurrent usage and some of the hosted application metrics that we provide.
Now, let’s dive a bit deeper to explain the details around this feature.
High level design
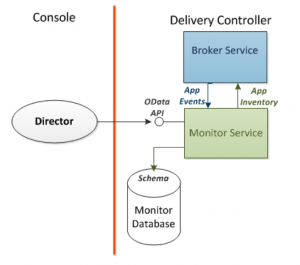
In XenApp/XenDesktop 7.6, we extended the monitor service data model to track hosted application usage counts and durations. This information will be exposed via the Director console and the OData API, essentially collecting and storing this data into the monitor database. The following diagram shows the high level architecture.
Usage metrics collected
Understanding the hosted application usage metrics will help you interpret the charts and data shown in Director. Our OData APIs use these same metrics and are available for custom report creation.
Application Instances
- Total count of application instanced running at any point in a date range (e.g. one hour, one day, one week)
- Count of running application instances grouped by application (counts grouped)
- Count of running application instances group by application and by user (counts grouped)
- Top n applications (grouped by application and the sorted by running instances count)
- Bottom n applications (including unused)
Application Duration
- Average duration per application per user for the time period
- Total duration per application per user for a date range
Application Launches
- Count of the number of times an application was successfully started in the time period. A reconnect does not count as a launch.
Concurrent Applications
- Peak concurrent applications for a time interval (hourly, daily, etc.) trended over a date range
- Peak concurrent application instance for a specific application for a time interval over a date range
- Top n peak concurrent applications over a date range (click on column to sort in descending order)
- Bottom n peak concurrent applications over a date range (including unused, click on column to sort in ascending order)
Distinct Users Running Applications
- Number of distinct users
- Number of distinct (unique) users running a specific application for a time interval trended over a date
- Peak Count of distinct users running a specific application for a time interval (i.e. hours over a date range
Trends reports
Types of reports
With the metrics collected above, we have created two new reports in the Trends view of Director.
- Usage trends for all hosted applications with a per application breakdown
- Usage trends for a particular application with a breakdown by user
Report filters
Director supports the ability to filter in all of the Trends reports. This same framework applies to the Hosted Application Usage reports. The administrator can select “All hosted applications” (default), or “Single application”.
Types of filters:
- Delivery group – restricts the report to a specific Delivery Group. By default, “All” is selected which assumes all accessible Delivery Groups.
- Time period – the time period selector is standard with other Trends reports. Administrators may choose a selection in the drop down (last 24 hours, last 7 days, last month, last year) and select either “Ending now” or a custom date.
If the “Single application” is selected, a search box will be presented and the administrator can then search for a specific application.
Hosted Application Usage report
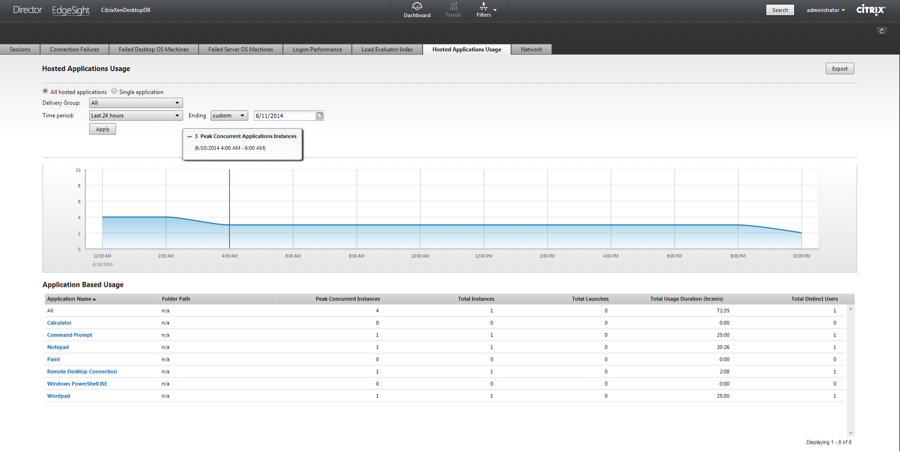
Below is a sample screenshot of the report in the Trends view: 
The Hosted Applications usage chart displays an aggregated view of hosted application usage over the time period selected for the applications. When “All” is selected, the chart displays metrics for the total hosted applications during that time period. Hovering over a data point displays tool tip details associated with that data point. The usage chart shows applications used during the time period. This excludes:
- Hosted applications created after the end of the time period
- Hosted applications that were deleted before the time period
- Hosted applications that are no longer visible due to changes in Delegated Administration (DA) permissions (DA scope is enforced based on current state)
The chart metrics show the counts of peak concurrent application instances.
Application Based Usage table
The table below the chart shows the metrics for the same time period selected in the report filter. The metrics are broken down by each application and each column is sortable (least/most) and scrollable. Clicking a specific application will navigate to an application specific report for that application.
Table metrics definition and metrics:
- Application Name – name of the Hosted Application
- Folder path – folder path (location) of the hosted application
- Peak Concurrent Instances – counts of peak concurrent application instances
- Total instances – counts of total application instances including running and not running
- Total Launches – counts of application launch events (does not include applications that have not launched in the time period)
- Total Usage Duration – Total duration of application usage in hh:mm
- Total Distinct Users – Count of distinct (unique) users
Specific Hosted Application Usage Report
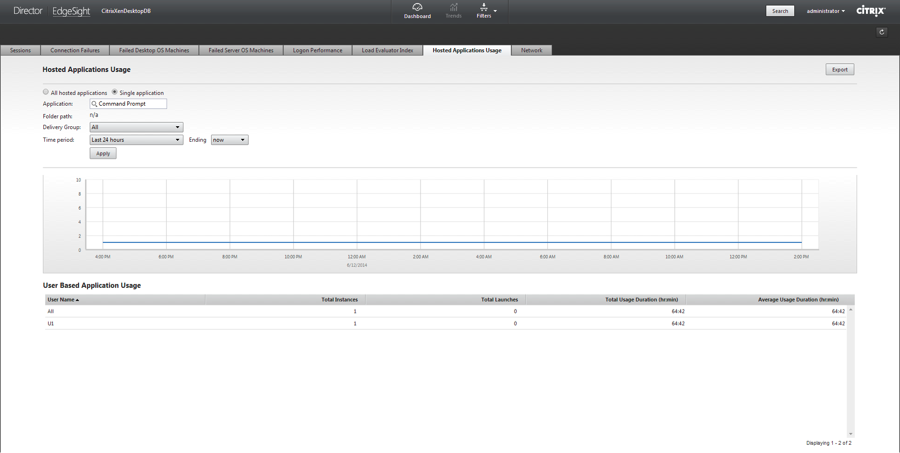
If selecting a specific application in the filters or clicking on an application in the Application Based Usage table, a new report will be shown for that application. A sample is below:
The chart displays the counts of peak concurrent application instances for the specific application based on the additional filters chosen.
User Based Application Usage table
Similar to the table mentioned above, this table shows the numeric values for the selected time period. The table is scrollable and each column is sortable in ascending/descending order. The table metrics are broken down on a per user basis:
- User name – username associated with the application instance
- Total Instances – counts of total application instances
- Total Launches – counts of applications launched
- Total Usage Duration (hh:mm) – total duration of application usage
- Average Usage Duration (hh:mm) – the average duration of the application usage
Metric calculation
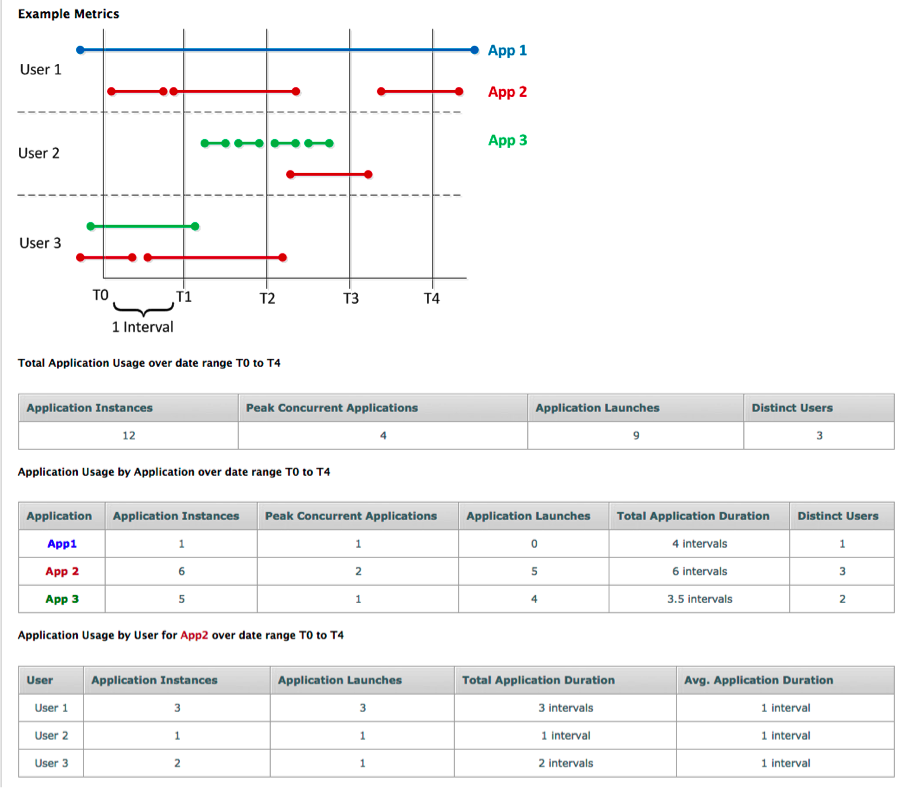
An example of how the metrics are calculated is below:
Limitations
Because this was extended in 7.6, the Hosted Application Usage feature requires Director and the Controller to be updated to 7.6 in order to collect the data and show the information in Director.
Hosted Application Usage is a feature of the EdgeSight performance management and thus the site must be licensed as a PLT edition to enable the Hosted Application Usage. These usage metrics will not be stored into the database unless the feature is enabled.
OData API
The monitor service OData API has been updated along with our documentation in o eDocs and also the new API reference documentation.
Summary
This has been one of the most requested features by customers and can be used to help in capacity planning, billing, and usage tracking. We are continuing to work on additional reporting capabilities so look for more in upcoming releases!


