Hypervisors have mechanisms to let administrators know when a host may be experiencing some event, condition or state that could affect the machines running on the host. These alerts need to be monitored to ensure the health of the sessions users are connected to. Administrators who are troubleshooting user issues from Director, need not have the host management consoles (Citrix XenCenter or VMWare vSphere Client) open just to see if the hosts are facing any issues. In order to give administrators a holistic view of the XenDesktop deployment and all hosts in the deployment at a glance, Hypervisor alerts are shown in Director. The administrator can then quickly access whether the issue the user(s) are reporting is a host related issue or not.
Hypervisor Alerts are shown under the Infrastructure panel of Citrix Director’s Dashboard view (1 in the screenshot below).
Alerts are displayed next to the Connection name of each of the Host / Cluster (2 in the screenshot above) that are configured for the site. The alerts are shown as the number (3 in the screenshot) of alerts triggered on all the host(s) within the cluster. If the administrator sees a non-zero number of alerts, she can then click on the number and a pop up will be shown to describe the alert(s).
The pop shows the number of alerts next to the name of the Host / Cluster. It then lists the alerts in descending order of time they had been raised. Each alert shows the time that it was raised, they type of alert and shows the name of the Host that alert was triggered on.
The different kinds of alerts that can be set are as follows:
- CPU Usage Alert – Alert is triggered if CPU utilization on the host goes over a preset threshold.
- Memory Usage Alert – Alert is triggered if Memory utilization on the host goes over a preset threshold.
- Network Usage Alert – Alert is triggered if Network traffic to and from the host goes over a preset threshold.
- Storage Throughput Alert – Alert is triggered if throughput from a Storage device attached to a host goes over a preset threshold.
The Hypervisor alerting is enabled by setting up alerts in Citrix XenCenter or VMWare vSphere Client for the hosts that have been configured to be a part of the deployment as defined via Citrix Studio, when creating the site or later.
Let me walk you through how you can set alerts from both these consoles.
Citrix XenCenter:
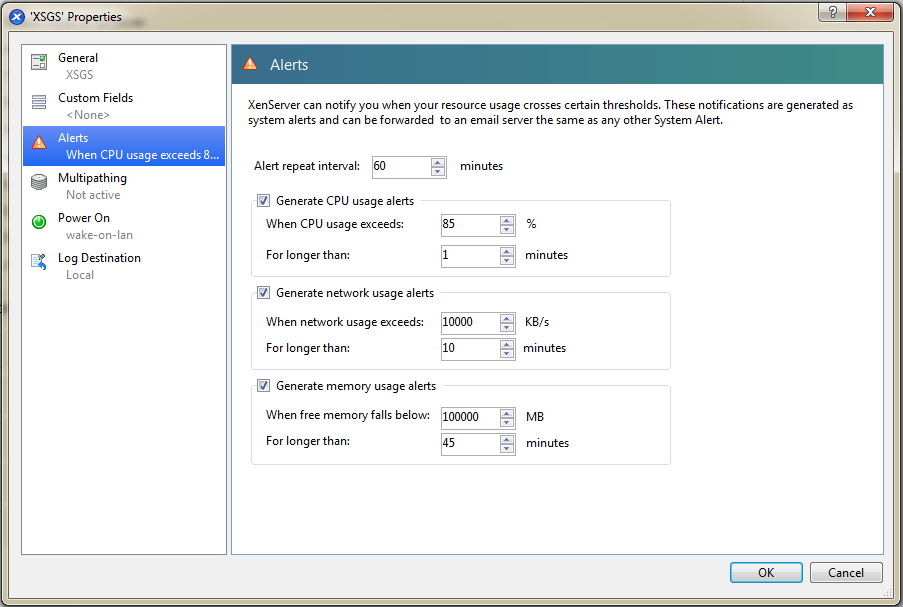
In all 4 of the alert types, you can also configure the amount of time that the threshold has to be breached for before the alert is raised per alert type.
CPU, Memory or Network Usage Alerts:
- Open XenCenter
- Right Click the Host you wish to configure the alert for and select Properties from the dropdown
- Click on Alerts.
- The Alert repeat interval option is used to set the interval to wait between two alerts of the same alert type.
- Select the check box next to the Alert you wish to select.
- The CPU, Memory and Network alerts are set based on % CPU used, free Memory left available for use and Network Throughput in KB/s respectively.
Set the thresholds you want for the alert as you require.
Storage Throughput Alert:
- Open XenCenter
- Right Click the Storage repository you wish to configure the alert for and select “Properties” from the dropdown.
- Click on “Alerts”.
- The alert repeat option exists here as well.
- Click the check box to enable/disable the alert.
Storage throughput alerts are set to be raised when the throughput in KB/s from the storage device on any host exceeds the configured threshold.
Note: The alert will continue to show up on the Dashboard for the period of the repeat interval even after the alert state has been resolved and the threshold is no longer being exceeded.
Supported versions and alerts:
1) XenServer and XenCenter version 6.2 – All.
2) XenServer and XenCenter version 6.0.2 – have only CPU and Network Usage alerts.
VMWare vSphere Client:
In VMWare parlance alerts are called Alarms. There are 2 locations from where Alarms can be set for the same Host.
The two locations are:
- From the inventory panel, when you right click a host the dropdown shows the Alarm option. Click on it and select the Add Alarm option.
2. From the Inventory Panel, select a host and click on the Alarms tab. The click on the “Definitions” view button below. Right click on the empty space and select the New Alarm option.
From this point on the steps are the same as both locations open the same panel.
On the General Tab, provide a name for the Alarm that you wish to set and a description if you wish. Leave the rest of default selections.
Select the Triggers tab, Click on Add and from the Trigger Type dropdown select one of the 4 options:
- Host CPU Usage (%)
- Host Disk Usage (KBps)
- Host Memory Usage (%)
- Host Network Usage (kbps).
Leave the “Is Above” option selected in the Condition dropdown and set the values for the conditions to trigger the alarm. And select OK. If either the warning or the alert condition is met the alert is shown in Director.
Once these are configured the alerts will show up in Director. (Assuming the host has been added in the Hosting Section from Citrix Studio.)
Supported Versions:
VMWare vSphere 5.0, 5.1 and 5.5
Caveats:
Hyper-V Alerts are not available via Director as the same are not exposed via an SDK, at the time of writing this blog.
The cluster level alarms are not supported via Director at the time of writing this blog.
Note: This blog is applicable to Citrix Director available with Citrix XenDesktop 7.0, 7.1 and 7.5


