I’m really surprised myself, but it’s been already 8 months since I wrote the first part of PVS internals. I’ve been extremely busy recently, so please accept my apologies it took so long to finish the second part of the blog post.
In first part, I’ve prepared the theoretical ground for the discussion about proper sizing of the memory. You should already understand the concept of Windows caching manager.
Introduction
There are a lot of misunderstanding and misconceptions about Provisioning Services – and one of them is that PVS requires a huge amounts of memory to work properly. Yes, PVS is using memory (as a cheap caching mechanism), however that doesn’t mean that you need to build supercomputer to use Provisioning Services. The reasons why PVS requires spare memory were already discussed in my previous article – it’s a service that is actually designed toleverage your unused memory.
When you ask any consultant about proper sizing of the PVS memory, you will probably either get answer “It depends” (don’t you love it?) or you will get calculations based on safe estimates. If you don’t have time or resources to do proper sizing, I highly recommend our consulting white paper describing advanced memory considerations for Provisioning Services (CTX125126). However (similar to the situation with pagefiles), it’s highly recommended to perform a proper sizing exercise – each project is different and sizing requirements can be completely different if you publish desktops with tons of applications compared to the situation where you simply publish locked-down published applications. And you want to identify if more memory is required before production rollout.
There are two utilities that I like to use whenever I work with PVS – one will give you very nice overview of the environment, while the second one can be considered as caching Swiss-army knife and can give you very specific details for your sizing.
Tools for memory sizing
There are two tools that I really love and use whenever I touch a PVS server. They work perfectly together:
- Resource Monitor – Resource Monitor is one of the most underrated built-in tools you can find in the Windows stack. Resource Monitor gives you very nice overview of your environment – you can easily find the bottlenecks, see an overview of CPU, memory, disk and network activities… And you can always dig deeper to get more details. Resource Monitor is the perfect combination of Performance Monitor and Task Manager.
- RamMap – RamMap is a great tool for more detailed investigation from Mark Russinovich. As discussed in previous article, PVS is using only physical memory for caching (pagefile is not being used for standby cache) and RamMap gives you perfect details about usage of your RAM.
When you combine them, you can see a global overview of your memory usage, but also see required details to make proper decisions. Be aware that while Resource Monitor is updated in real-time, RamMap requires manual refresh.
Recommended approach
For monitoring of memory usage, we will use both utilities. While Resource Monitor will provide us with information about general memory consumption, we will use RamMap to determine how much memory we actually need for each vDisk.
The whole process can be defined as following:
- Empty standby cache to get clear results
- Boot target device to logon screen – 1st check
- Wait for Windows to fully load – 2nd check
- Logon first user – 3rd check
- Run regular applications, ideally performed by regular users – 4th check
- Shutdown target device – 5th check
- Review memory requirements
- Boot as many devices as you want and let them run for few days\weeks
Example sizing
Below you can find a step-by-step process to better understand memory usage of your PVS servers.
Environment consists of a single Windows Server 2008 R2 image that will deliver only the IE application. The size of the image is 40 GB and we store our vDisks locally.
First, we shut down all devices that are using PVS to get a clear picture of our environment. Nothing should read from PVS server and make sure you’re not copying any data to\from PVS server.
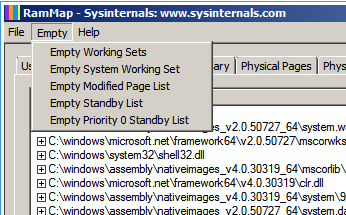
We use RamMap to clear the standby cache (option “Empty Standby List”):

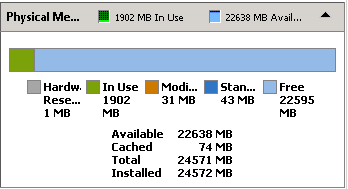
At this moment, our PVS server is running with empty standby cache. We can easily confirm this by looking at Resource Monitor:


Now it is time to start our VM(s). I usually boot up multiple VMs at the same time – since they’re booting at the same time from standard image, there shouldn’t be much difference between booting one or multiple VMs.
As soon as we start booting the VMs, we can see that standby cache is increasing:
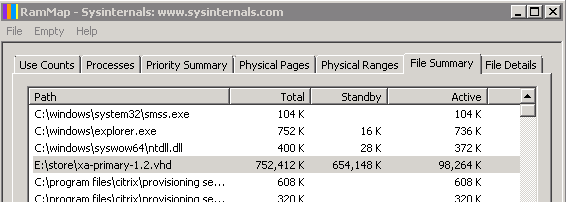
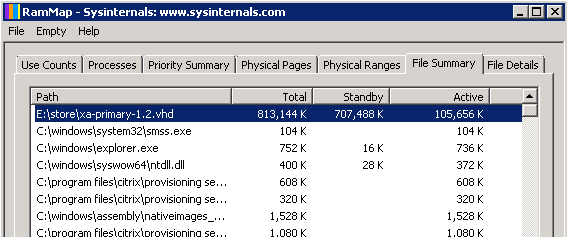
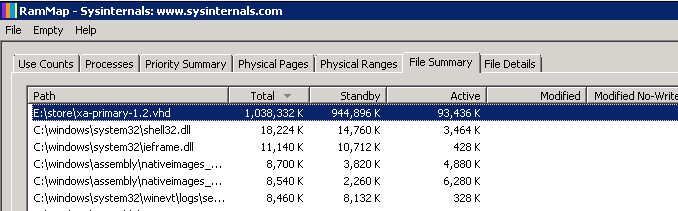
If we switch to RamMap and select “File Summary” tab, we can clearly see who is responsible for filling the cache:
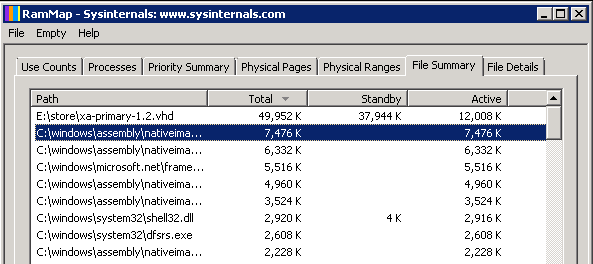

Have you noticed something? The .VHD file is not only stored in standby cache, but in active page pool also. This is caused by StreamProcess.exe process. This is important because some pages are active and monitoring only the size of standby cache wouldn’t be an accurate representation (since almost 25% of the total is not stored in the standby cache).
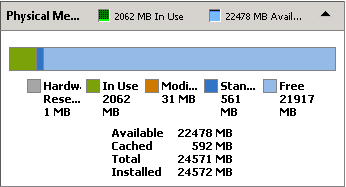
As soon as we hit the logon screen (Press Ctrl + Alt + Delete to log on), we can see that the image occupies around 450 MBs of memory:
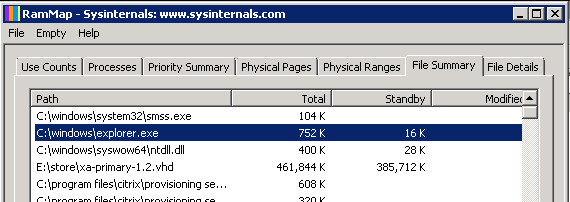

Standby cache on the other hand is already 561 MBs. This is caused by the fact that Windows is not only caching our .VHD file, but also any other buffered read operation:

Now we could say that PVS needs to read ~450 MBs to fully boot Windows Server 2008 R2, however this statement would not be correct. Remember the “Lie-To-Children” section from my previous article? Windows is a lot more complicated than we like to admit and there is a lot more under the hood than meets the eye. So while preparing for logon (and you can actually logon already), there are still a lot of operations going on in the background.
Therefore, it’s important to identify when we decide that Windows is fully booted. In my case, I always deliver farm configurations through group policy, so I will wait until XenApp joins the farm – and to be sure it’s really idle, I will wait until the reported load is 0 (Qfarm /Load) – just for your information, the different between “farm join” and “zero load” is around 250 MBs:

Now I can say that the fully loaded XenApp image requires around 735 MBs. If you compare it to simple logon screen check, you can see the difference of almost 300 MBs.
The next important step is user logon. On the average, the first user logon will require an additional 50-60 MBs (less with local accounts), even when your default profile is only 1 MB. The potential reason (I just take it as a fact and never spend too much time investigating) is that there are other OS components involved in first logon – for example calls of specific APIs (from libraries that were not downloaded yet):

After we log off this first user, we can see that our situation is actually very similar with first logoff – again, it’s not a simple removal of the folder, but additional APIs are involved:


Just to show you the difference between standby cache and the actual file memory usage, here is the same screenshot from Resource Monitor. Notice that standby cache is 1292 MBs (as we have seen before, only 740MBs are actually used by our vDisk):

The difference between those two numbers can actually tell you how much memory you should allocate to PVS server cache at a minimum (operational memory + default system cache + vDisk system cache). Our default recommendation is to reserve 512 MBs of system cache for operating system itself, you can see that this number pretty much reflects real life experience.
This is penalty of first logon\logoff – the rest of the users are not affected by this. This is similar to first user impact of application streaming building its cache and streaming the application. Can you pre-cache the first user? Hardly, the only potential solution would be auto-logon with a strictly limited user or initiating the process that will also load the user profile, however, this would require careful consideration due to security reasons. The majority of data reads during profile creation are actually from the System32 folder and not from the C:\Users folder itself. The potential gain is probably very small for XenApp servers, however could be more interesting for XenDesktop workloads (and could potentially lead to PVS Internals 3 article).
Our server can be considered fully prepared for user load at this point – now it’s time to ask your pilot users to perform some tests. At the end, you might be very surprised – in my case, the average memory requirements for running few servers for 4 days was only around 1 GB:

Does this mean that I need only 3 GBs of memory for my PVS server (2GB for OS and 1GB for vDisk)? Definitely not and it would be very bad decision. Let’s have a look at our sizing formula:
2GB + (#XA_vDisk * 4GB) + (#XD_vDisk * 2GB) + 15% (Buffer)
We’ve just proved that our vDisk doesn’t require more than recommended memory, so in this case recommendation would be to stick with 4GB of memory per vDisk. If our testing would reveal higher memory requirements, we would need to increase this requirement, however with very few exceptions, this formula should cover majority of cases. Don’t forget that you need to provide some system cache for non-PVS related pages (this is included in 15% buffer).
Be aware that this doesn’t actually mean that you need to reserve 1GB of memory for this vDisk. The goal of PVS is to optimize ~80% of the disk load operations, however if PVS needs to read from a disk every now and then, it doesn’t actually mean your sizing is wrong.
Summary
There are a few general recommendations that you should follow when doing memory sizing for PVS.
- Do not use size of the vDisk to calculate memory requirements. The cache manager is caching blocks, not the whole files, so you don’t need to plan for caching the entire VHD in memory. You will probably be surprised how little memory you actually need for the average operating system.
- Don’t aim to cache 100% of read operations. Don’t aim to provide 100% read operations from cache – you can probably provide 80% success rate with as much as 2-4GB of memory for each vDisk (with exceptions of course).
- Don’t use standby cache for sizing. Windows will try to cache everything, as long as there is enough memory – and files are never removed from cache unless there is better use for that memory. If you will leave your PVS server for few weeks and then decide you need to buy more RAM because there is no free memory, you should return back to PVS Internals 1 and read it more carefully this time. As I’ve tried to explain, PVS actually requires a lot less memory than most people expect.
- Don’t underestimate the memory of your VMs. Having a lot of memory for PVS server itself, while not having enough memory for your VMs is very common mistake. Don’t forget that your target devices are also using system cache – and this is reducing the re-reads from PVS server. You should reserve at least 500 MBs for single-user OS and at least 2GB for multi-user OS to be used by system cache.
- Clear your cache before benchmarking. Make sure to always empty standby cache before recording any numbers to get clear results. Windows will try to cache everything, so it’s easy to get your cache “filled”. This is completely normal and as explained before, thanks to the prioritized cache manager, one-shot operations are not going to override your frequently accessed data blocks. For your final sizing numbers, don’t forget to add some overhead (typically around 15%).
- Identify breakpoints during your tests. Don’t expect that Windows is fully loaded when the logon screen appears. As you will see in your tests, it is still reading data in the background.
- Be aware of any component that reads all files. If you have incorrectly configured antivirus or other components that can read the disk, your standby cache can easily get filled. Make sure to monitor your cache usage to detect such issues in advance. This problem can occur on both PVS server and the target device itself.
- Use our magic formula unless you have a very specific reason not to do so. This formula covers majority of implementations. Unless you have a very specific reason to do so or you have large number of vDisks, you should follow it. Just to remind you, here it goes again:
2GB + (#XA_vDisk * 4GB) + (#XD_vDisk * 2GB) + 15% (Buffer)
I would also like to thank my colleagues Dan Allen, Nicholas Rintalan and Pablo Legorreta (in alphabetical order, so they don’t fight) for their tremendous help!
Martin Zugec